


Markets and economic outlook remain constructive amid oil-driven narrative
Review the latest Weekly Headings by CIO Larry Adam.
Key takeaways
- The Fed maintained a constructive economic outlook despite the conflict
- Real-time economic indicators suggest the US economy remains on solid footing
- We maintain our year-end S&P 500 price and EPS targets of 7,250 and $300
Spring is a season usually associated with renewal. Unfortunately, it also marks the point when our most optimistic scenario – a quick resolution to the Iran conflict (15% probability) – fell away. While US and Israeli military superiority is clear, rising concerns around the duration of energy disruptions through the Strait of Hormuz have unsettled markets and the region. Our base case (60% probability) now assumes the conflict in total lasts four to five weeks, a more dangerous phase marked by strained diplomacy, expanding airstrikes and limited infrastructure damage.
The key swing factor remains oil prices. If the conflict ends within this window, we still expect only limited impacts on our economic and asset‑class outlooks. The greater risk lies in our pessimistic scenario (25% probability), where a longer conflict would materially raise the odds of broader market spillovers. Below, we update our investment views based on the latest developments.
Oil drives the narrative
As we’ve noted, oil remains the key swing factor for Fed policy, the economy and equity markets. While prices are still near $100/barrel, our base case view is that oil falls toward $60/barrel by year‑end.
The Fed stays the course
This week’s Federal Open Market Committee meeting largely reinforced our own view that the Iran conflict has had limited economic impact so far. In fact, the Fed modestly upgraded its growth outlook, raising its 2026 GDP forecast from 2.3% to 2.4% – in line with our expectations – while leaving its unemployment projections and rate path (dot plot) largely unchanged. The Fed did nudge its 2026 inflation forecast higher, from 2.5% to 2.7%, but that move largely reflected inflation pressures already evident in this week’s Producer Price Index, even before the conflict intensified.
Echoing our perspective, Chair Jerome Powell noted in his press conference that the US economy is doing “pretty well” and that it remains “too soon” to fully assess the economic effects of the conflict. For now, rising energy prices are the key variable the Fed is watching most closely. Bottom line: Like us, the Fed remains constructive on the outlook and sees no reason –yet – to materially rethink its view of the economy.
US economy still blooming
While the recent surge in gasoline prices to about $3.88 per gallon has certainly grabbed attention, its impact on economic activity so far has been modest. Yes, a move above the psychological $4 per gallon mark could dent consumer confidence and prompt households to rethink discretionary spending, but some important buffers remain in place.
Gasoline now accounts for just 1.7% of the average household’s annual spending, roughly half its share from 15 years ago. At the same time, consumers are getting a meaningful income boost this year with tax refunds expected to be about $1,000 higher than last year.
For that cushion to be fully erased, gasoline prices would need to rise to $5 per gallon and stay there through the end of September, a scenario we see as very unlikely. What we’re seeing in real‑time data also supports this view. Air travel remains strong, with TSA passenger volumes up 3% year over year.
Retail sales, restaurant bookings and Visa spending data are also all running well above last year’s levels, showing no signs of a pullback. On the business side, investment –particularly in AI – remains healthy, reinforced by recent CEO commentary. And importantly, the US economy’s status as a net exporter of oil further reduces its sensitivity to higher energy prices. Bottom line: Higher gas prices are a headwind, but they are not derailing the economy. Growth remains on solid footing, supported by resilient consumers, ongoing business investment and a more energy‑independent US economy.
Equity market transition
The S&P 500 has just experienced its first 5% pullback in five months, and it’s worth emphasizing that this is entirely normal. Historically, markets typically see three to four pullbacks of this size each year.
While the conflict has been the primary catalyst this time, it hasn’t been the only source of volatility. Other headlines, ranging from private credit concerns and AI fatigue to questions around new leadership at the Fed, have also contributed. With valuations elevated coming into the year, this environment is exactly why we entered 2026 with one of the more conservative forecasts on Wall Street, including our 7,250 year‑end target for the S&P 500.
Despite recent volatility, we remain confident in that target, which implies more than 10% upside from current levels. First, many of our favored sectors are less exposed to Middle East tensions, including tech and health care. Industrials should benefit from increased defense spending and the AI buildout, while transportation‑related industries are likely to rebound as energy prices ease.
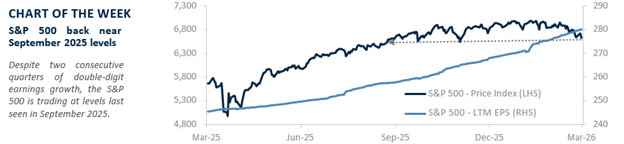
Importantly, our S&P 500 earnings forecast remains unchanged at $300, well below the current consensus of $313. Second, the excessive optimism we flagged earlier in the year has begun to unwind. Bearish sentiment is now at its highest level since last May, a contrarian positive. Third, valuations have improved as the market has moved sideways while earnings continued to grow. The S&P 500 is trading near last September’s level, yet companies have delivered two quarters of double‑digit earnings growth. Bottom line: With fundamentals still healthy, this pullback is improving, not diminishing, the upside to our year‑end target.
All expressions of opinion reflect the judgment of the author(s) and the Investment Strategy Committee and are subject to change. This information should not be construed as a recommendation. The foregoing content is subject to change at any time without notice. Content provided herein is for informational purposes only. There is no guarantee that these statements, opinions or forecasts provided herein will prove to be correct. Past performance is not a guarantee of future results. Indices and peer groups are not available for direct investment. Any investor who attempts to mimic the performance of an index or peer group would incur fees and expenses that would reduce returns. No investment strategy can guarantee success.
Economic and market conditions are subject to change. Investing involves risks including the possible loss of capital.
The information has been obtained from sources considered to be reliable, but we do not guarantee that the foregoing material is accurate or complete. Diversification and asset allocation do not ensure a profit or protect against a loss.
The S&P 500 Total Return Index: The index is widely regarded as the best single gauge of large-cap U.S. equities. There is over USD 7.8 trillion benchmarked to the index, with index assets comprising approximately USD 2.2 trillion of this total. The index includes 500 leading companies and captures approximately 80% coverage of available market capitalization.
Sector investments are companies focused on a specific economic sector and are presented here for illustrative purposes only. Sectors, including technology, are subject to varying levels of competition, economic sensitivity, and political and regulatory risks. Investing in any individual sector involves limited diversification.

Raymond James financial advisors may only conduct business with residents of the states and/or jurisdictions for which they are properly registered. Therefore, a response to a request for information may be delayed. Please note that not all of the investments and services mentioned are available in every state. Investors outside of the United States are subject to securities and tax regulations within their applicable jurisdictions that are not addressed on this site. Contact your local Raymond James office for information and availability.
Links are being provided for information purposes only. Raymond James is not affiliated with and does not endorse, authorize or sponsor any of the listed websites or their respective sponsors. Raymond James is not responsible for the content of any website or the collection or use of information regarding any website's users and/or members.
Investment advisory services offered through Raymond James Financial Services Advisors, Inc.. TowneBank and Towne Wealth Management are not registered broker/dealers and are independent of Raymond James Financial Services. Investment products are: not deposits, not FDIC/NCUA insured, not insured by any government agency, not bank guaranteed, subject to risk and may lose value.
© 2026 Securities offered through Raymond James Financial Services, Inc., member FINRA / SIPC
| Legal Disclosures | Privacy, Security & Account Protection | Terms of Use
Investment and Insurance products are:
- NOT A DEPOSIT
- NOT FDIC-INSURED
- NOT GUARANTEED BY TOWNEBANK
- NOT INSURED BY ANY STATE OR FEDERAL GOVERNMENT AGENCY
- SUBJECT TO RISK AND MAY LOSE VALUE
