


Markets: What to watch midway through 2026
Review the latest Weekly Headings by CIO Larry Adam.
Key takeaways:
- The US economy remains on solid footing with GDP expected to rise 2.4% in 2026
- Easing energy prices should help the recent inflation spike fade
- US equities remain the best performer in the global arena
It’s hard to believe we’re nearing the halfway point of 2026 – and what an eventful start it’s been. Markets have pushed through a geopolitically driven energy shock, rising inflation pressures and accelerating disruption from the artificial intelligence boom. Looking ahead, July marks a historic milestone as the United States celebrates its 250th anniversary – a powerful reminder of its enduring strength, innovation and economic leadership. That resilience has been on full display, with the economy advancing despite uncertainty and the S&P 500 reaching new highs. As we prepare to release our mid-year outlook, here’s what we’re watching in the second half of 2026:
The US economy is earning its stripes
The US economy continues to defy expectations, demonstrating resilience in the face of a sharp rise in oil prices following the US-Iran conflict and persistent geopolitical uncertainty. Growth remains solid, supported by steady consumer spending, a stabilizing labor market, ongoing fiscal support, and sustained investment in AI and infrastructure. Importantly, this capex boom is not only driving demand but also boosting productivity, reinforcing the economy’s foundation. Looking ahead, we expect growth to remain on firm footing, with GDP rising 2.4% and the unemployment rate holding near 4.3% in 2026. While consumer spending should stay supportive, early signs of strain are emerging. Elevated inflation, negative real wage growth and a declining savings rate warrant close attention, though lower gasoline prices should offer some near-term relief.
Inflation finds independence from oil
Since the US-Iran ceasefire, oil prices have fallen sharply, with WTI now near $70 per barrel, down from above $100 just weeks ago. Even so, the earlier surge still poses risks to growth and the Federal Reserve’s (Fed) rate outlook, particularly with inflation running above the Fed’s 2.0% target for more than five years. That said, with a US-Iran deal now in place, supply conditions are improving. Vessel traffic through the Strait of Hormuz is rebounding, with the seven-day average rising to ~30 from 13 a week ago. While normalization still has further to go, easing energy pressures should help the recent inflation spike fade. This should give the Fed, under new Chair Kevin Warsh, room to hold rates steady through 2026, while keeping the door open for a potential cut in 2027. While markets continue to price in a rate hike or two this year, we disagree and expect the Fed to remain on hold.
Fixed income’s triumphant return
The recent shift in the Fed’s outlook and persistent inflation have pushed Treasury yields higher year to date, with the 2-year yield up 72 basis points (bps) to 4.10% from its pre-war low of 3.38%, and the 10-year yield rising roughly 45 bps to 4.39%. With yields now near multi-decade highs, bonds have re-emerged as a compelling source of income rather than an afterthought in portfolios. Importantly, investors no longer need to take excessive risk to generate income. Case in point: the Bloomberg US Aggregate yield is now more than three times higher than the S&P 500 dividend yield – the widest gap we’ve seen in decades. Looking ahead, steady growth and solid demand for Treasuries should keep the 10-year Treasury yield range bound, ending the year in the 4.25% to 4.50% range. That backdrop is constructive, as elevated starting yields offer an attractive entry point. In this environment, we continue to favor high-quality bonds, including Treasuries, investment-grade corporates and municipals.
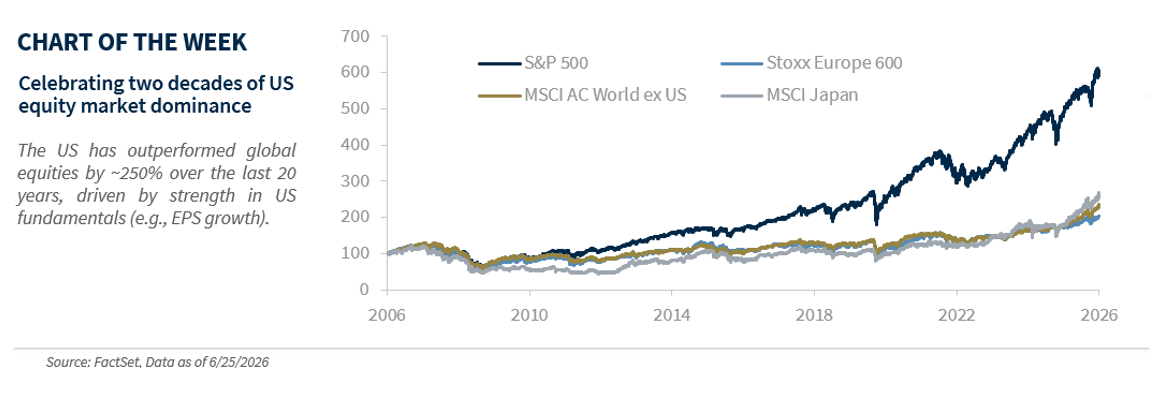
US equities still sparkle
US equities are off to a strong start, with the S&P 500 up 8.1% and the tech-heavy NASDAQ up 9.1% tear to date. While midterm election years typically bring more muted returns, the S&P 500’s solid performance this year has been driven by better-than-expected earnings, with consensus forecasting 25% year-over-year 2026 earnings-per-share growth alongside meaningful upward revisions of roughly 10%, among the strongest in the past two decades. Technology remains the clear earnings leader, with ~52% 2026 year-over-year earnings-per -share growth, but we also expect broader participation from industrials, consumer discretionary and healthcare – each supported by solid earnings growth and durable secular tailwinds. Even with volatility likely to pick up in second half – driven by elevated valuations and midterm election uncertainty – our S&P 500 targets of 7,650 by year-end and 8,200 over the next 12 months point to further upside. And with the US the best performer over the last two decades (see chart below), we maintain our preference for the US other developed equity markets.
Bottom line
Much like our nation itself, the market fundamentals remain resilient. The backdrop supports a constructive outlook for investors in the second half – though, as always, we stay vigilant with surprises never far from view.
All expressions of opinion reflect the judgment of the author(s) and the Investment Strategy Committee and are subject to change. This information should not be construed as a recommendation. The foregoing content is subject to change at any time without notice. Content provided herein is for informational purposes only. There is no guarantee that these statements, opinions or forecasts provided herein will prove to be correct. Past performance is not a guarantee of future results. Indices and peer groups are not available for direct investment. Any investor who attempts to mimic the performance of an index or peer group would incur fees and expenses that would reduce returns. No investment strategy can guarantee success.
Economic and market conditions are subject to change. Investing involves risks including the possible loss of capital.
The information has been obtained from sources considered to be reliable, but we do not guarantee that the foregoing material is accurate or complete. Diversification and asset allocation do not ensure a profit or protect against a loss.
The S&P 500 Total Return Index: The index is widely regarded as the best single gauge of large-cap U.S. equities. There is over USD 7.8 trillion benchmarked to the index, with index assets comprising approximately USD 2.2 trillion of this total. The index includes 500 leading companies and captures approximately 80% coverage of available market capitalization.
Sector investments are companies focused on a specific economic sector and are presented here for illustrative purposes only. Sectors, including technology, are subject to varying levels of competition, economic sensitivity, and political and regulatory risks. Investing in any individual sector involves limited diversification.

Raymond James financial advisors may only conduct business with residents of the states and/or jurisdictions for which they are properly registered. Therefore, a response to a request for information may be delayed. Please note that not all of the investments and services mentioned are available in every state. Investors outside of the United States are subject to securities and tax regulations within their applicable jurisdictions that are not addressed on this site. Contact your local Raymond James office for information and availability.
Links are being provided for information purposes only. Raymond James is not affiliated with and does not endorse, authorize or sponsor any of the listed websites or their respective sponsors. Raymond James is not responsible for the content of any website or the collection or use of information regarding any website's users and/or members.
Investment advisory services offered through Raymond James Financial Services Advisors, Inc.. TowneBank and Towne Wealth Management are not registered broker/dealers and are independent of Raymond James Financial Services. Investment products are: not deposits, not FDIC/NCUA insured, not insured by any government agency, not bank guaranteed, subject to risk and may lose value.
© 2026 Securities offered through Raymond James Financial Services, Inc., member FINRA / SIPC
| Legal Disclosures | Privacy, Security & Account Protection | Terms of Use
Investment and Insurance products are:
- NOT A DEPOSIT
- NOT FDIC-INSURED
- NOT GUARANTEED BY TOWNEBANK
- NOT INSURED BY ANY STATE OR FEDERAL GOVERNMENT AGENCY
- SUBJECT TO RISK AND MAY LOSE VALUE
